
Training seriously in cycling can’t be imagined without a power meter nowadays. If you got yourself a power meter, chances are, you have no idea what to do with the data. It just looks like alternating numbers on the screen. And when you look at your ride afterward it gets even more obscure: Cryptic terms and confusing spreadsheets that look like stock charts.
If this describes you then keep reading as I’m about to analyze one of my rides to show you what I look for.
First things first, we should look at a fundamental tool to get the most out of our rides.
1. Get a Training Peaks Account
Honestly, if you don’t have a TrainingPeaks Account yet, you should get one. Because Training Peaks is an online training platform, where you can upload and analyze your ride data and keep track of your progress with a training log.
Training Peaks has a lot of features that go behind those of other online platforms like strava. And what’s better you get a lot of these features already in your free account. Download the Training Peaks app on your mobile and have access to it everywhere.
Especially when uploading ride data continuously for years you’re able to compare different seasons, phases, or blocks with each other. This way you’re able to learn from past mistakes. By now, you can even track things like sleep and weight with TrainingPeaks, making it a great tool for cyclists to get faster.
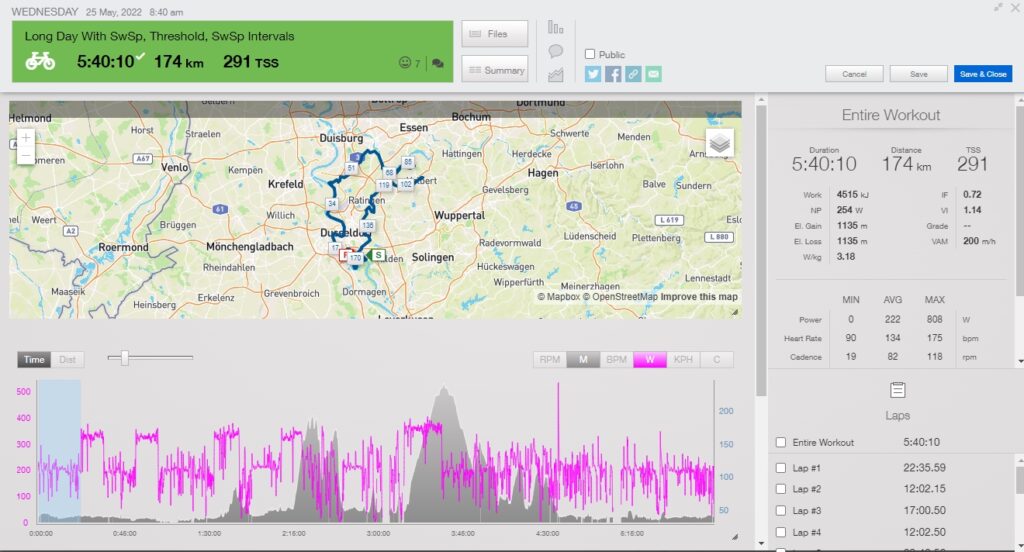
The ride I’m going to analyze was a 6-ish hour endurance-paced ride with sweet spot intervals and a hard threshold effort after accumulating 2500 Kilojoules to test the legs against late race fatigue resistance.
2. Understanding Power Metrics
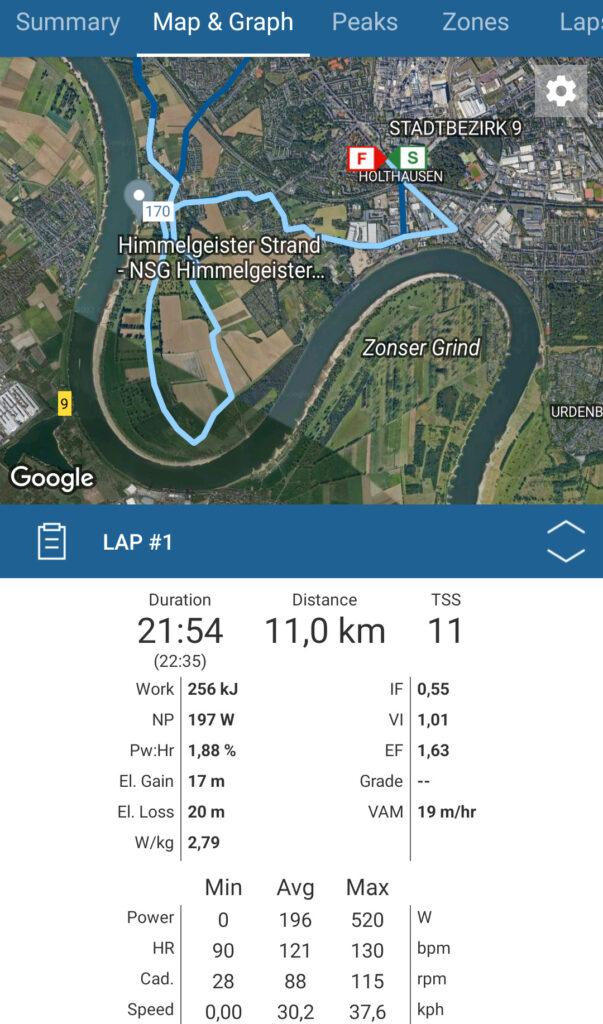
I started the ride with a 22-minute warm-up before I hit the first 12-minute interval at sweet spot. What we notice is how steady the warm-up and intervals were. This is pretty typical when riding on flat roads or climbs by yourself versus riding with a group.
The question is how can we tell that my warm-up and intervals were more steady than the rest of the ride other than just looking at the power spikes? We can look at the Variability Index (VI) in the top ride column. The VI indicates how smooth your power output was by dividing Normalized Power (NP) by Average Power (AP).
What is Normalized Power?
Normalized Power is a weighted average power that shows you how hard your ride is if you have gone consistent. Thereby, the “real” metabolic cost of a ride can be better demonstrated as the variability of a ride is considered. Because Average Power is just as the name suggests: The average power produced on a ride. Normalized Power is used to calculate other important metrics like TSS, Intensity Factor (IF), Efficiency Factor (EF), and Variability Index as already mentioned.
3. Interpreting Power Meter Data
Looking at the Variability Index for endurance rides and steady-state efforts you want to ride as smoothly as possible. And the closer VI is to 1 the more consistent your power output is. If we look at the warm-up segment and the late threshold interval we notice a Variability Index of 1,01 for the warm-up and 1,00 for the threshold interval. This is because NP and AP are very close together. This is extremely consistent riding.
On the other hand, the more surges and coasting the higher the Variability Index. So, with the VI we can fine-tune our workouts towards our goal races. For example, in a time trial, you would go for very steady efforts and VI, whereas for a crit you would mimic a higher VI in training.
Please note: The first things I look at when analyzing a ride are the Normalized Power, the Average Power, and, the Variability Index. Afterward, I do the same thing for the intervals.
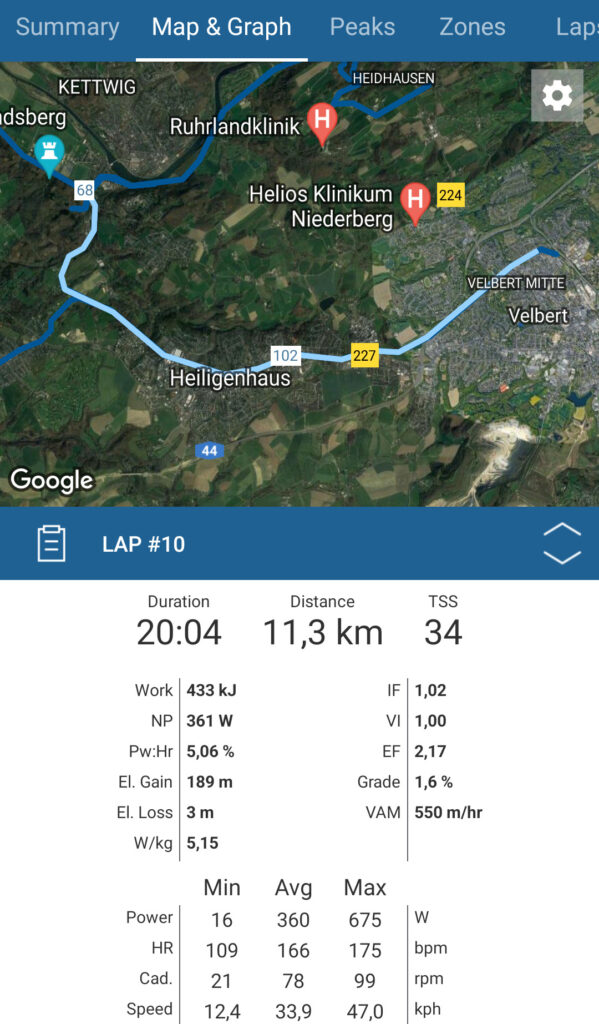
I look at the lap and see if I reached the prescribed goal for the interval. For steady-state efforts I want my power output to be smooth. For punchy intervals, I want to make sure that I hit the target power from the first to the last surge and keep the right intensity during recovery periods. By looking at the intervals you can even compare peak power values from this year’s intervals to last year’s intervals and track progress.
In the next step, I look at two more metrics: Training Stress Score (TSS) and Intensity Factor (IF).
4. Terminology for Power-Based Training
Intensity Factor
TSS and IF are two other important metrics to refer to when analyzing a training ride. But the most important requirement for all these numbers, to be useful and accurate, is to set up your FTP correctly in Training Peaks.
To do that you go to settings – zones – power zones and then type in your FTP. If you don’t know what FTP is check out my article.
Talking metrics IF tells you how hard your ride was. This is done by dividing Normalized Power by FTP. If you ride at your FTP, your IF would be 1. If you ride above FTP, your IF would be higher than 1. And if you ride below FTP, IF would be below 1.
IF gives you a good estimate of how intense your ride was. My IF was 0.72 for that day, which is typical for a long endurance ride with steady-state efforts. Shorter interval rides would have a higher IF value because they are just that: More intense. As IF is relative to your FTP it represents your ability. 72% percent of FTP gives me a good idea of how hard I went.
But the intensity is only one part of the equation. The other part is duration. And here TSS comes into play.
The Role of TSS
TSS takes both IF and the duration of the ride into account. For that day I had a TSS of 291, which is high for an individual workout. I could accumulate that TSS in less time by going harder, so TSS is a great estimate of how taxing a training session was, instead of just counting hours.
And as TSS is based on IF and IF is based on your FTP, your TSS is unique to you. If someone did the same ride as me but had a higher or lower FTP than me, the TSS would look different for both of us. It gives you an individual estimate of stress on your system.
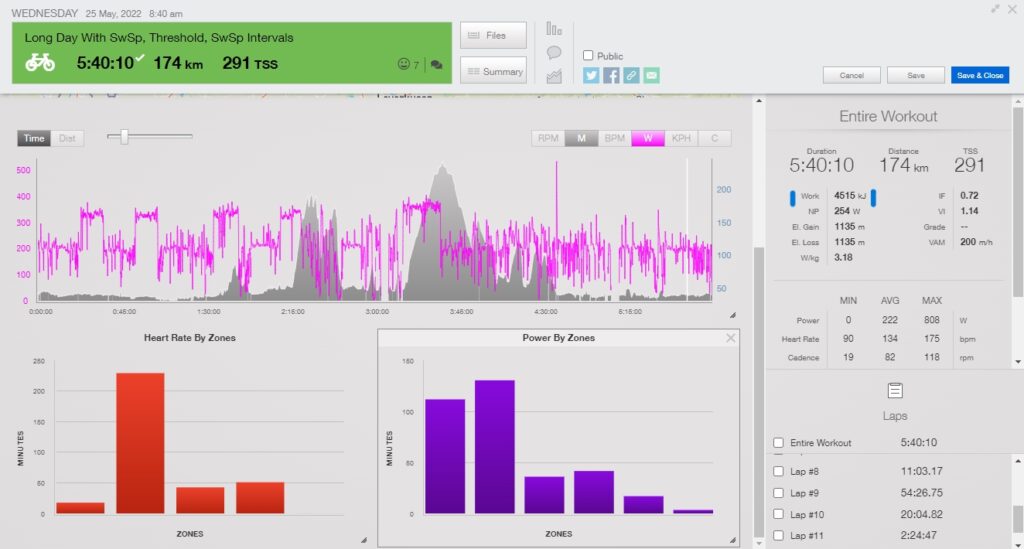
Another thing I do is look at time spent in zones. My goal was endurance with sweet spot and threshold work. Looking at the chart we notice it’s exactly what I did as most of my ride was done in Zones 1 and 2 with a good amount in Zone 3 and 4.
Kilojoules or Calories
One last thing to look at is work done in kilojoules. Kilojoules give you a good estimate of how taxing the ride was or to put it differently: Kilojoules are roughly equivalent to calories burnt on the bike.
Why is that when 1 calorie is around 4.184 Kilojoules? The reason is that our body is only 20-25% efficient in producing energy. Therefore, calories burnt roughly equals Kilojoules. That makes Kilojoules a reliable estimate to plan our fueling needs for the ride and after being done riding.
Finale Thoughts
Let’s do a quick recap. I first look at Normalized Power and Average Power and their relationship through the Variability Index. This gives me a good indication of how smooth and consistent the power was on that ride. I then looked up closely at all the efforts I made and if I reached the prescribed power as well as the intensity of the ride through Intensity Factor and TSS.
Finally, I looked at Time Spent in Zones to check if I was in the Zones I intended to be and the work done in Kilojoules to see how taxing the workout was and how to reach my fueling needs.
This habit helps me to get the most out of my rides and train to the best ability. And I hope it will help you, too.
Ready to Improve Your Cycling Performance?
If you enjoyed this and want to improve your cycling performance, then get your hands on one of my plans, available on TrainingPeaks, and ride faster for longer, or click below to get my specific base, build, and peak plans for amateur and elite cyclists:
- RV The Block Periodization Plan, 4 Weeks (6-8 Hours)
- RV Improve Your FTP, 8 Weeks on 6 Hours, 10 Hours, or 15 Hours
- RV Road Racing Build, 8 Weeks on 6 Hours, 10 Hours, or 15 Hours
Follow me on Instagram for more Cycling Content.
- Get my favorite Power Meter *here.
- Get my favorite Shoes *here.
- Get the Vittoria Corsa Tyres I use *here.
Footnotes
Training Peaks website – all terms reserved to TrainingPeaks LLC
What is Normalized Power? – Training Peaks
Variability Index – Training Peaks
Intensity Factor – Training Peaks